What is customer acquisition cost (CAC)?
Customer acquisition cost is the total amount a business spends on sales and marketing to acquire one new paying customer. Calculated by dividing total acquisition spend by the number of net new customers in a given period, it’s the single most misread metric in ecommerce — because most merchants calculate it wrong, benchmark it wrong, and try to fix it the wrong way.
I’ll be straight with you.
Every week I see a Shopify merchant look at their dashboard, watch their customer acquisition cost go up, and make the same move: cut ad spend, look for cheaper traffic, try a new channel. Maybe test influencers. Maybe switch from Meta to TikTok.
It almost never works. And the reason isn’t the ads.
The diagnosis is wrong.
After working with hundreds of ecommerce brands through Retainful, the pattern is pretty consistent: the merchants who actually lower their effective CAC — not just the number on the dashboard, but the real cost per profitable customer — don’t do it by spending less on acquisition. They do it by fixing what happens after someone clicks.
The abandoned carts that nobody follows up on. The first-time buyers who get zero post-purchase communication. The retention engine that was never built because everyone was too busy optimizing ad creative.
Customer acquisition cost isn’t your problem. It’s the symptom. This guide is about finding the actual disease – and understanding what your CAC number really means depending on your vertical, your product type, and your growth stage.
First, Calculate It Right — Because Most People Don’t
Before you compare your number to any benchmark, make sure you’re working with an accurate one. Most CAC calculations I’ve seen are wrong — not deliberately, just wrong in ways that quietly cause bad decisions.
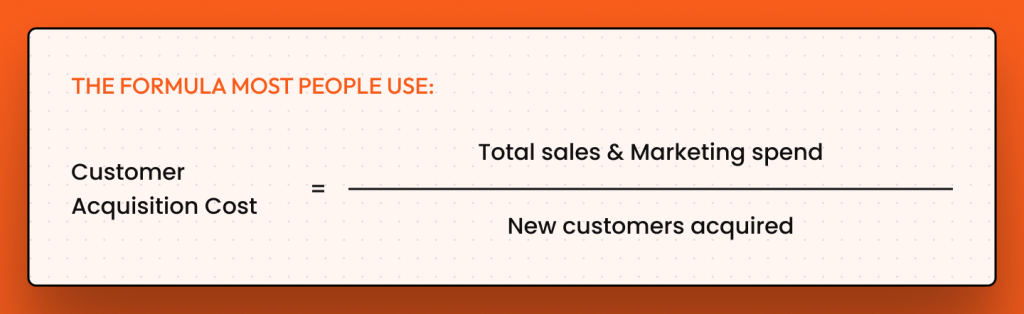
The formula most people use:
CAC = Total Sales & Marketing Spend ÷ New Customers Acquired
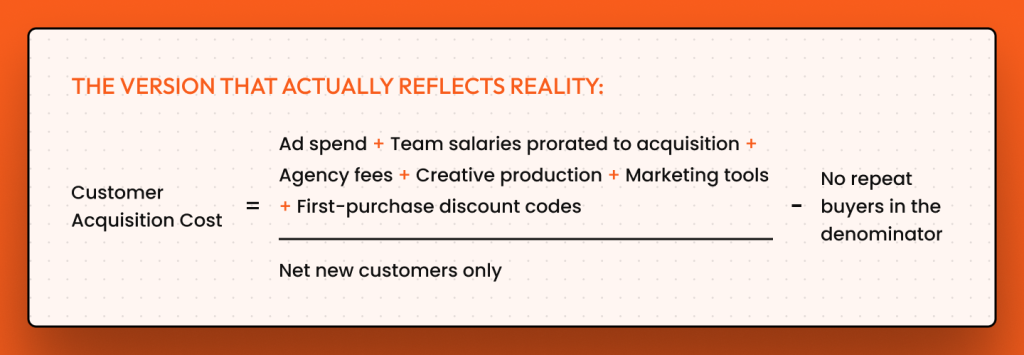
The version that actually reflects reality:
Customer Acquisition Cost = (Ad Spend + Team Salaries prorated to acquisition + Agency Fees + Creative Production + Marketing Tools + First-purchase Discount Codes) ÷ Net New Customers Only — no repeat buyers in the denominator
The most common mistake: including returning customers in your denominator. Say you spent $10,000 in a month, acquired 80 new customers, and also had 120 repeat purchases. Your CAC is not $10,000 ÷ 200 = $50. It’s $10,000 ÷ 80 = $125.
That’s a $75 difference per customer. Enough to completely change whether your unit economics are healthy or not. Including returning customers flatters your number and causes you to systematically underestimate what it actually costs to grow.
Costs that most Shopify merchants forget to include:
- Influencer gifting and seeding — if you sent $500 in product to creators this month, that’s acquisition spend
- First-purchase discount codes — a $20 welcome discount is functionally a $20 customer acquisition cost
- Creative production — the designer, the video editor, the photographer who shot your ads
- The pro-rated time of anyone whose job touches acquisition (your full-time marketer isn’t free, even if they’re on salary)
- App subscriptions for acquisition-adjacent tools — attribution platforms, landing page builders, A/B testing tools
A brand spending $8,000/month on ads, $2,000 on creative, $500 on tools, and $1,500 on a part-time marketer has a true acquisition spend of $12,000. Not $8,000. The CAC calculation off $8,000 is 33% too optimistic.
Blended CAC vs Channel CAC— why you need both
Blended CAC is total acquisition spend divided by all new customers, regardless of where they came from. It’s your business-level health metric.
Channel CAC isolates cost by individual channel — Meta, Google Shopping, TikTok, email, referrals, whatever.
They tell completely different stories.
Your blended CAC can look perfectly healthy while one specific channel is quietly hemorrhaging money. I’ve seen fashion brands with a $68 blended CAC whose TikTok CAC was $140 and email referral CAC was $12. Cutting the whole budget because the blended number looked “high” would have killed their most efficient channel. Track both. Always.
What’s a Good Customer Acquisition Cost? It Depends Entirely on Your Vertical.
This is where most CAC guides completely fail. They throw out one number — “the average ecommerce customer acquisition cost is $70” — as if a pet food brand and an electronics retailer are playing the same game. They’re not even in the same sport.
Here’s what the benchmarks actually look like, drawing from Shopify’s internal data, First Page Sage’s analysis of 80+ ecommerce clients (2025), and Mobiloud’s 2026 benchmark report:
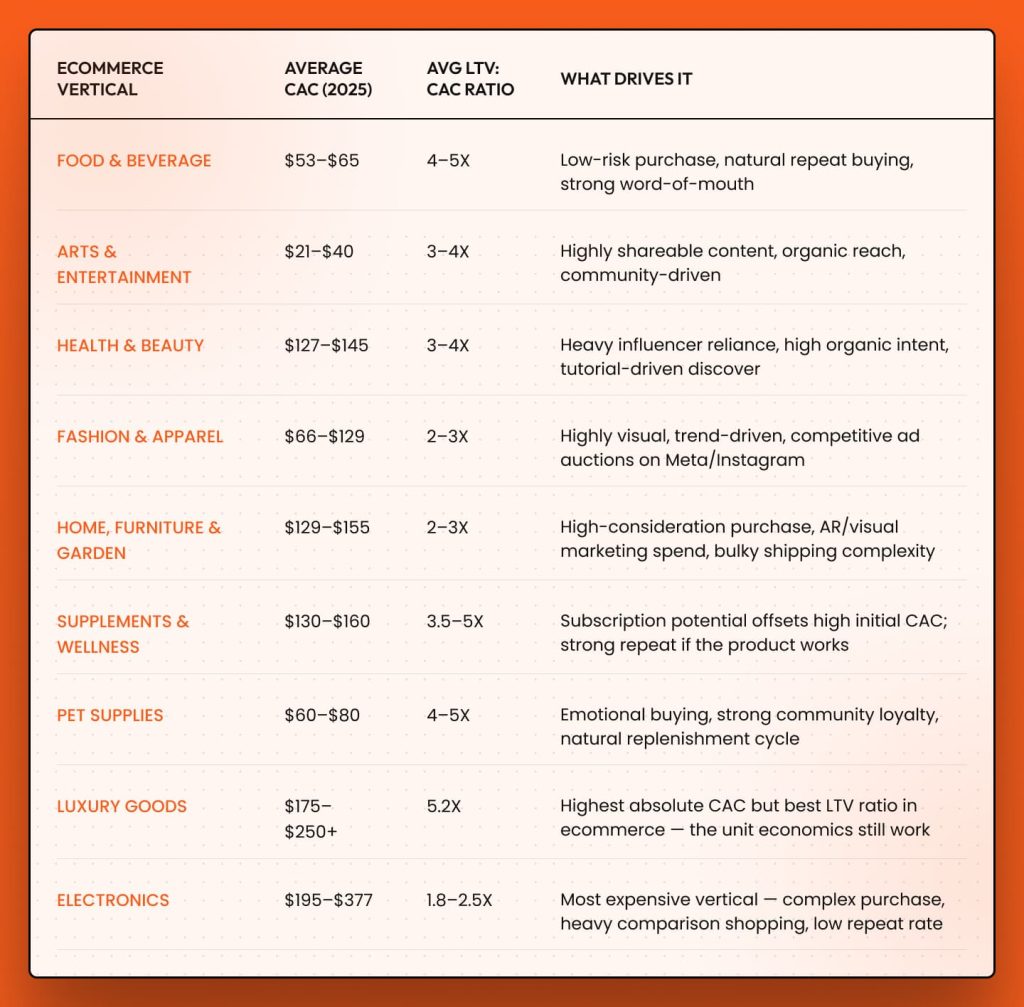
Sources: Shopify (2021, 2024), First Page Sage (2025, 80+ ecommerce clients), Mobiloud/Upcounting (2026), LoyaltyLion (2025)
Two things in that table are worth sitting with.
Electronics has the highest CAC and the lowest LTV ratio — double pressure on margins simultaneously. An electronics store acquiring at $250 with a 2x LTV ratio is in a structurally difficult spot: spending the most to acquire customers who come back the least. Compare that to pet supplies at $70 CAC and a 4–5x LTV ratio — those brands can afford to be patient and outspend short-term.
Luxury is the most counterintuitive one. A $200 customer acquisition cost looks like a problem on a dashboard. It isn’t — not when the customer LTV is $1,000+. The 5.2x ratio is the best in ecommerce. This is why context always beats the raw number.
The macro context you can’t ignore
Average retail CAC hit $226.38 in 2024 — up 7% year-over-year — as ad platforms continue demanding higher premiums. Zoom out further: the average customer acquisition cost is now 60% higher than it was five years ago.
This isn’t bad targeting on your part. It’s structural. iOS privacy changes gutted targeting precision. Temu and Shein alone spent an estimated $2.7 billion on digital advertising in 2023 — Temu reportedly put $1.2 billion into Meta alone. Etsy’s CEO called them out directly for “almost single-handedly impacting ad costs across the industry.” Google Shopping CPCs jumped 33.72% in 2025. Meta’s Q4 2025 CPM averaged $22.98, peaking at $25.22 during Black Friday.
What that means practically: your CAC is going up partly because of forces that have nothing to do with you. Which makes optimizing what you can control — your funnel conversion, your retention, your LTV — more important than ever.
The Mental Model Shift That Changes Everything
Here’s the thing most ecommerce brands figure out too late: CAC is retroactive.
The number on your dashboard today is not a fixed cost. It changes depending entirely on what happens after acquisition.
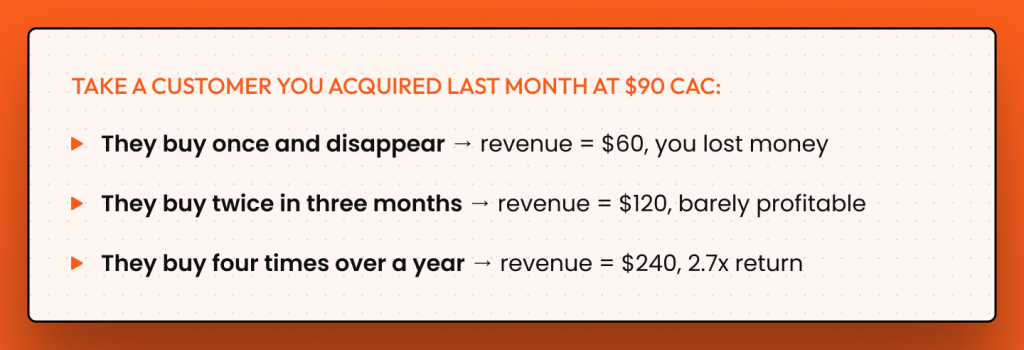
Take a customer you acquired last month at $90 CAC:
- They buy once and disappear → revenue = $60, you lost money
- They buy twice in three months → revenue = $120, barely profitable
- They buy four times over a year → revenue = $240, 2.7x return
Same acquisition cost. Same customer. Three completely different financial outcomes — determined entirely by your post-purchase experience.
This is why merchants who obsess over lowering their customer acquisition cost while ignoring retention are solving the wrong problem. You’re trying to fill a leaky bucket by turning the tap down. The answer is to patch the leaks.
LTV: The Number That Makes CAC Make Sense
CAC without LTV is noise. Every decision about whether your customer acquisition cost is acceptable, too high, or dangerously low depends on LTV. There’s no way around this.
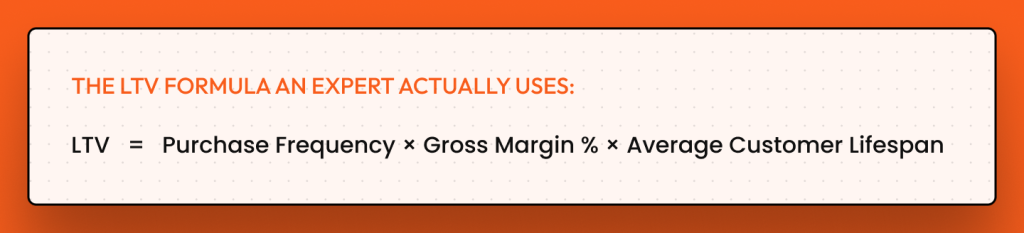
The LTV formula an expert actually uses:
LTV = AOV × Purchase Frequency × Gross Margin % × Average Customer Lifespan
Let me walk through a real fashion brand example:
- AOV: $75
- Purchase frequency: 2.4x/year
- Gross margin: 55%
- Customer lifespan: 2 years
- LTV = $75 × 2.4 × 0.55 × 2 = $198
With a CAC of $68, this brand has an LTV:CAC ratio of 2.9:1 — technically just below the healthy 3:1 threshold. Marginal, but workable.
Now watch what happens when they implement a post-purchase email sequence and improve purchase frequency from 2.4x to 3.5x per year:
LTV = $75 × 3.5 × 0.55 × 2 = $288.75 New LTV:CAC = $288.75 ÷ $68 = 4.2:1 ✅
Same customer acquisition cost. For same ads, and same product. Just better retention — and the business is now meaningfully more profitable. They didn’t lower their CAC. They made the same CAC worth more.
That’s the question the top 1% of ecommerce operators are asking: what would it take to move purchase frequency from 2.4x to 3.5x? That’s a retention question, not an acquisition one.
CAC Payback Period: Where Cash Risk Hides
Most Shopify brands track CAC and LTV. Very few track payback period. That’s a mistake — because payback period is the number that can sink a growing store even when the LTV:CAC ratio looks fine on paper.
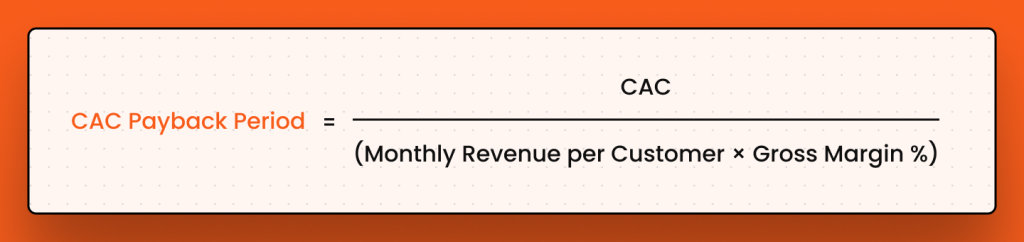
CAC Payback Period = CAC ÷ (Monthly Revenue per Customer × Gross Margin %)
Scenario A — health & beauty brand, $140 CAC, customer buys $65/month at 55% gross margin:
Monthly gross profit = $65 × 0.55 = $35.75 Payback = $140 ÷ $35.75 = ~4 months ✅
Clean. They’re recovering customer acquisition cost in 4 months and everything after is pure profit.
Scenario B — same brand, same product, same CAC. But purchase frequency drops from monthly to quarterly:
Monthly gross profit = ($65 × 0.55) ÷ 3 = $11.92/month Payback = $140 ÷ $11.92 = ~12 months ⚠️
Same product, customer acquisition cost, and LTV. But now you’re waiting a full year to break even on each customer. If you’re growing 30% month-over-month, you’re continuously in a cash hole — acquiring customers faster than you’re recouping cost — even though your LTV:CAC ratio still looks healthy on paper at 3:1.
This is the exact mechanism behind why fast-growing ecommerce brands run out of cash at what looks like peak success. They’re profitable on a long enough timeline. They’re cash-negative in the short term. And when growth requires capital, there’s none left.
The practical fix: segment your customers by first-purchase product or category, calculate payback period per segment, and prioritize acquisition of cohorts with the shortest payback. A supplement brand might find that customers who start with the 3-month bundle have a 45-day payback versus 6 months for single-unit buyers. That one insight changes your entire homepage, ad creative, and offer structure.
Industry Benchmarks: Deep Dive on Each Vertical
The table above gives you the number. Here’s what actually drives it — and the edge cases that make your real customer acquisition cost look very different from the published benchmark.
Food & Beverage ($53–$65 average CAC)
The best CAC profile in ecommerce. Low-stakes purchase decision, natural repeat buying (people run out of product), and word-of-mouth travels well. A coffee or snack brand can profitably acquire at $55 because by month four, most customers have bought three or four times.
Edge case — the seasonal food trap: Holiday food brands — gift boxes, Valentine’s chocolate, Christmas hampers — acquire customers cheaply in Q4 because gift intent is high. Annual blended customer acquisition cost looks excellent at $35–$45. But cohort data usually reveals 80–85% of those customers never return after Q4. The effective CAC for acquiring a recurring customer is often $200+. These brands need an entirely different Q1 strategy: early re-engagement flows, year-round gifting occasion triggers, and a non-seasonal product line to bridge the gap.
Fashion & Apparel ($66–$129 average CAC)
Wide range reflecting enormous variation in brand positioning. A DTC streetwear brand fighting for attention on TikTok sits at $90–$129 because paid social spend is constant and high. A niche vintage resale brand with a loyal organic community operates at $66–$75.
The structural challenge in fashion is trend velocity — you can’t stop spending or you lose cultural relevance, which makes customer acquisition cost structurally elevated versus most categories.
Edge case — collection drop spikes: A brand dropping a summer collection in June can see acquisition costs climb 30–40% because every fashion brand is bidding on summer keywords simultaneously. If your benchmark CAC is $85, plan for $110–$120 during major launch windows.
Health & Beauty ($127–$145 average CAC)
The most bifurcated vertical. Brands with strong organic communities and UGC pipelines — active YouTube channels, loyal Instagram followings, tutorial-first content — operate at the low end. Brands relying primarily on Meta and influencer spend sit at the high end.
LTV ratios are solid (3–4x) because customers who find a skincare or wellness routine they trust tend to repurchase consistently. That repeat behavior is what makes the higher initial customer acquisition cost worthwhile.
Edge case — the knockoff problem: Beauty brands with a hero product that gets copied cheaply face sudden CAC spikes with zero warning. When knockoffs appear on Amazon or Temu, prospective customers start comparison shopping, conversion rates drop, and customer acquisition cost climbs — without any change in your ad spend. The defense is brand equity and community, not price.
Home, Furniture & Garden ($129–$155 average CAC)
High-consideration, high-AOV purchases that require multiple touchpoints before conversion. A customer doesn’t buy a sofa after seeing one ad — they might interact with your brand 8–12 times across 3–6 weeks before committing. This makes attribution messy and CAC calculations genuinely difficult.
Edge case — the mixed-ticket problem: Stores selling both low-ticket accessories ($25 planters, $18 candles) and high-ticket furniture have wildly misleading blended CAC. Accessories inflate customer count and make cost look low. The actual customer acquisition cost for a buyer who purchases a $1,200 sofa is often 2–3x the blended number. Segment by product category before drawing any conclusions.
Electronics ($195–$377 average CAC)
The hardest unit economics in ecommerce. Customers comparison shop obsessively, buy infrequently, and are extremely price-sensitive. The funnel requires investment at every stage: awareness content, review placements, comparison guides, technical specs, and often live chat support. After someone buys a laptop or a camera, they’re not back for 2–3 years.
Edge case — accessories as the actual business model: An electronics brand with a $400 camera at $280 CAC and 2x LTV barely breaks even on the camera. Build an accessories ecosystem — lenses, bags, filters, memory cards — and each camera buyer becomes worth $600–$800+ LTV over 18 months. The base product is the acquisition vehicle. The accessories are where the profit actually lives.
Pet Supplies ($60–$80 average CAC)
One of the best retention profiles in ecommerce. Pet owners are emotionally invested, brand-loyal, and operate on predictable replenishment cycles. Once you win a pet owner’s trust, they tend to stay.
Edge case — community acquisition: Acquiring customers through pet events, animal shelters, or vet referrals can bring customer acquisition cost down to $15–$25, well below paid social. These customers also show stronger retention because there’s an emotional anchor to how they discovered the brand. In this category, community-based acquisition is probably your single highest-leverage channel.
Luxury Goods ($175–$250+ average CAC)
The most counterintuitive performer. Highest absolute CAC, but the best LTV:CAC ratio in ecommerce at 5.2x. A $200 customer acquisition cost with a $1,040 LTV is far better economics than a $70 CAC with a $140 LTV — yet most operators instinctively feel the $200 number as a problem.
The real risk in luxury isn’t customer acquisition cost — it’s payback period. High-ticket purchases happen infrequently, meaning you might be 12–18 months from breaking even on each new customer. You can only scale aggressively here with patient capital and a defensible LTV model backed by real cohort data.
The 3 CAC Problems — And How to Diagnose Which One You Have
When a Shopify merchant tells me “my customer acquisition cost is too high,” it’s almost always one of three different problems wearing the same label. The fix for each is completely different.
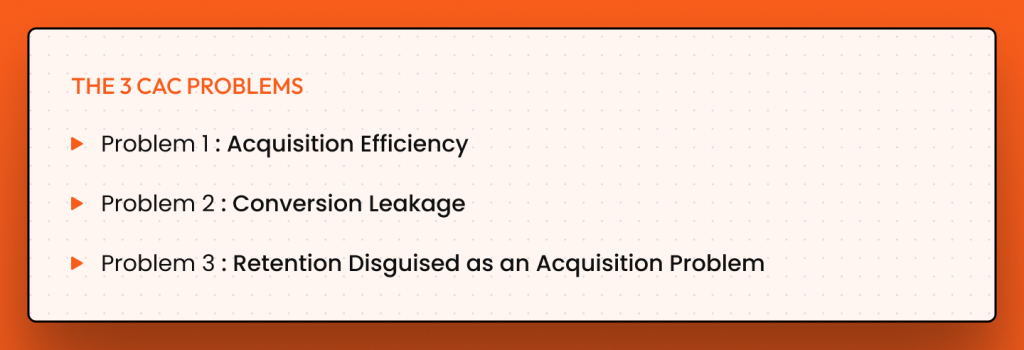
Problem 1: Acquisition Efficiency
Your ads are reaching the wrong audience, your creative isn’t converting, or you’re overbidding on the wrong keywords. Signs: high CPM, low CTR, high CPC, low top-of-funnel conversion rate. This is the only scenario where optimizing ad spend directly solves the problem.
Problem 2: Conversion Leakage
Traffic is reaching the right people but bleeding out before purchase. This is where cart abandonment lives. The Baymard Institute puts average ecommerce cart abandonment at 70.19%. Most Shopify stores have zero recovery flow in place.
Here’s the math: if 1,000 people add your product to cart and 701 abandon without buying, you’ve already paid to acquire all 1,000 visitors. Your CAC is calculated against the 299 who converted — meaning those 299 customers are carrying the acquisition cost of the 701 who left.
A store that implements a 3-step abandoned cart email and SMS sequence and recovers just 15% of abandonments suddenly has 15% more customers from the same ad budget. No new creative or channel testing. No bid adjustments. Just plugging a leak that was already there.
Problem 3: Retention Disguised as an Acquisition Problem
This is the sneakiest one. CAC looks fine. Ad performance looks fine. But blended numbers are deteriorating because you’re acquiring customers who buy once and vanish. You’re running a churn problem wearing an acquisition costume.
The signal: repeat customers may only make up around 21% of a store’s customer base, but they drive up to 44% of all revenue. A store where 85% of customers never come back has to run its acquisition engine at full throttle just to maintain flat revenue.
If your 90-day repeat purchase rate is below 15% and new customer volume looks strong but overall revenue is flat, this is almost certainly your problem.
The Compounding Math of Retention vs Acquisition
Most merchants frame this as a choice: optimize customer acquisition cost OR fix retention. It’s not a choice — but the math of each option clarifies exactly why retention should come first.
Scenario: fashion brand, CAC = $85, current LTV = $170 (2:1 ratio)
Cut customer acquisition cost 20% (from $85 to $68):
- LTV:CAC improves to 2.5:1
- Gain: $17 more margin per customer
- Trade-off: requires painful ad optimization, channel reduction, or creative testing — all of which risk volume
Improve LTV 25% through retention (from $170 to $212):
- LTV:CAC also improves to 2.5:1 — same result as Option A
- Gain: $42 more value per customer
- No sacrifice in ad volume or reach
Improve LTV 25% AND reinvest freed margin into acquisition:
- Higher LTV means the brand can now profitably spend $95–$100 CAC
- They can outbid competitors still capped at $85
- The retention advantage becomes a structural acquisition advantage
This is the compounding loop the best Shopify brands are running: strong retention → higher LTV → higher defensible customer acquisition cost ceiling → more aggressive acquisition → larger customer base → better retention data → even stronger LTV.
Retention doesn’t just fix your ratio. It raises the ceiling on how aggressively you can acquire — and keeps raising it every quarter.
Edge Cases Every Ecommerce Brand Should Know
The seasonal brand trap
Gifting brands — Christmas ornaments, Halloween costumes, Valentine’s boxes — acquire customers cheaply in Q4 when purchase intent peaks. Annual blended customer acquisition cost looks excellent: $35–$45. Cohort data usually tells a different story: 80–85% of those customers never return post-holiday. The effective CAC for acquiring a recurring customer is often $200+.
The fix isn’t just Q1 re-engagement sequences. It’s building a year-round product and communication strategy that gives seasonal customers a reason to stay outside the holiday window.
The subscription vs. one-time purchase math
A supplement brand converting first-time buyers to monthly subscription — even at a slight discount — completely changes its customer acquisition cost economics:
- One-time buyer: $50 AOV, 2.2x/year → $110 LTV at 55% margin = $60.50 profit per customer
- Subscriber: $40/month, 12x/year → $480 LTV at 55% margin = $264 profit per customer
The subscriber generates 4.4x more profit from the same acquisition cost. Even at 20% subscription conversion, the LTV lift meaningfully changes what you can afford to spend acquiring new customers across the whole channel.
The marketplace vs. DTC split
Brands on both Amazon and Shopify often have a misleading CAC picture. Amazon’s built-in traffic cuts paid customer acquisition cost roughly in half — but those customers belong to Amazon. No email ,retargeting or brand relationship.
The brands that navigate this well use Amazon as the discovery channel and migrate buyers to their DTC store via packaging inserts, warranty registrations, and exclusive community offers. Amazon reduces top-of-funnel cost. Shopify is where lifetime value actually gets built.
The hero product problem
Many stores have one product driving 70%+ of revenue — a mattress, a standing desk, a water filter. Great conversion rates. Almost zero repeat purchase occasion. The entire business becomes dependent on continuously acquiring new customers at high customer acquisition cost just to maintain flat revenue.
The solution is deliberate product line expansion: accessories, consumables, adjacent products that create natural repeat purchase occasions. The hero product is the entry point. The ecosystem is where the business actually lives.
The high-return-rate silent kille
Fashion and apparel brands face a specific CAC distortion: returns. If your calculation uses gross orders instead of net customers after returns, your customer acquisition cost is understated. Retail returns hit $890 billion in 2024, representing 16.9% of total sales.
A fashion brand with a 30% return rate is spending approximately 43% more per net customer than their dashboard shows.
True CAC = Reported CAC ÷ (1 − Return Rate)
At 30% returns: a reported CAC of $85 → True customer acquisition cost = $85 ÷ 0.70 = $121.43. That’s not a rounding error. That’s the difference between a healthy and an unhealthy business.
The 5-Point CAC Audit Before Changing Anything
Before you touch your ad spend or restructure your channel mix, run this. Most Shopify merchants will find the real problem in steps 2–4, not step 1.
- Are you calculating it right?
Rebuild your customer acquisition cost from scratch including all costs. Compare blended vs. channel CAC. Identify your 3 highest-CAC channels and 3 lowest. The gap between them is usually more actionable than the average. - What’s your cart abandonment recovery rate?
If you’re not recovering 10–15% of abandoned carts through email and SMS flows, that’s a mechanical leak inflating your effective CAC. Fix this before anything else. - What’s your 90-day repeat purchase rate?
Healthy benchmark is 20–30% for most verticals. Below 15% means you’re running a retention problem that’s showing up as an acquisition problem. - What’s your CAC payback period by cohort?
Calculate it for your top 3 customer segments by first-purchase product or acquisition channel. Any segment with payback beyond 6 months — ask whether you have the working capital to keep scaling at your current growth rate. - What’s your LTV:CAC ratio by channel?
Customers from referrals, organic search, and email tend to have meaningfully higher LTV than paid social customers. If paid acquisition dominates your mix, you may be systematically acquiring lower-value customers at higher cost while underinvesting in the channels that bring better ones.
Frequently Asked Questions
Shopify’s data shows an average retail CAC of $226.38 for US DTC brands in 2024, up 7% year-over-year. By vertical, costs range from $53 (food & beverage) to $377+ (electronics), with a broad category average of $68–$84 — though vertical mix heavily skews that number.
It’s structural, not strategic. Google Shopping CPCs jumped 33.72% in 2025 and Meta CPMs hit all-time highs at $22.98 in Q4. The same budget simply buys fewer clicks than it did a year ago. The lever you control: improve your conversion rate to extract more customers from the same traffic
No — this is one of the most expensive misconceptions in ecommerce. A $200 CAC is bad with a $220 LTV. It’s excellent with a $1,000 LTV. High CAC + high LTV = great business. High CAC + low LTV = you’re burning money.
Blended CAC (all spend ÷ all new customers) is your business-level health metric. Channel CAC isolates a single channel for optimization. You need both — blended to understand your business, channel to know where to shift budget.
Three highest-leverage moves: implement abandoned cart recovery (10–15% recovery meaningfully lowers effective CAC), improve product page and checkout conversion, and build a referral program — referred customers cost 5–10x less to acquire and typically carry higher LTV.
3–6 months is healthy. 6–12 months is acceptable with strong retention data. Beyond 12 months is risky without exceptional LTV visibility and patient capital.
What This Means for Your Store Right Now
The ecommerce customer acquisition cost environment is structurally harder than it was three years ago. Ad costs are rising. Attribution is getting messier. The era of cheap Facebook arbitrage that powered the first wave of DTC brands is over.
But the merchants winning right now aren’t winning by finding cheaper traffic. They’re winning by building the retention infrastructure that makes expensive traffic worth it.
A $90 CAC is a crisis if your LTV is $100. It’s a genuine competitive advantage if your LTV is $360 — because you can spend what your competitors can’t afford to, acquire customers they can’t reach, and compound that edge every single quarter.
Ecommerce brands now lose an average of $29 on every new customer acquired, after factoring in marketing costs and returns. The only way to make that math work is through repeat purchases — where profits average $39 per transaction.
The first sale is the investment. Everything after it is the return.
Build your retention system, recover your abandoned carts, build your repeat purchase flows — and your effective customer acquisition cost will drop without changing a single ad. That’s not a theory. That’s what I’ve watched happen across hundreds of Shopify stores.